


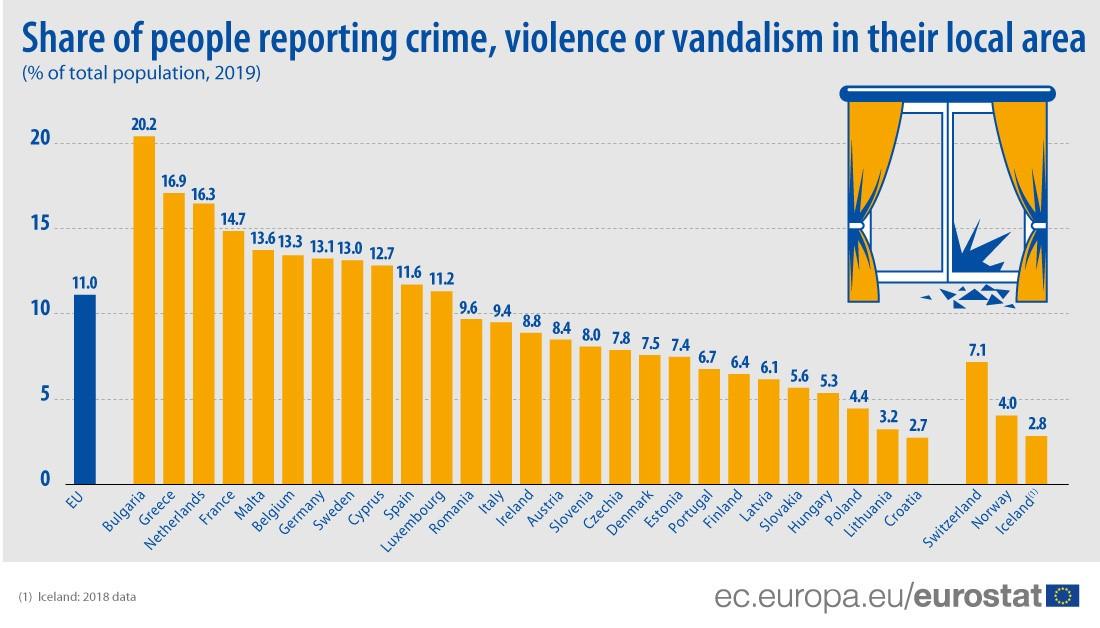
Decoding Crime Statistics: A Comprehensive Guide to Accurate Interpretation
Exploring the Foundations of Crime Data Collection
Crime data originates from multiple channels, each offering distinct perspectives while also presenting inherent challenges. The backbone of crime statistics is formed by official law enforcement records, which document offenses reported to police departments. Complementing these are victimization surveys like the National Crime Victimization Survey (NCVS), which capture incidents that victims may not report to authorities. Additionally, journalistic accounts and scholarly research contribute valuable insights, though their methodologies and focus areas can vary widely. Understanding these diverse sources is essential for critically analyzing crime figures rather than accepting them uncritically.
Several elements influence the dependability and comparability of crime data, including:
- Variations in Reporting: Differences in police reporting protocols and public willingness to report crimes can distort statistics.
- Disparities in Crime Definitions: Jurisdictional differences in how crimes are legally defined affect classification.
- Data Gathering Techniques: The contrast between survey-based data and official records impacts the scope and completeness of information.
| Data Source | Advantages | Drawbacks |
|---|---|---|
| Police Records | Extensive coverage of reported offenses | Common underreporting; varies by crime type |
| Victim Surveys | Includes unreported crimes | Relies on respondent accuracy and memory |
| Media Reports | Spotlights notable or sensational cases | Selective focus; potential for exaggeration |
Challenges and Variability in Crime Data Reporting
While crime statistics are vital for shaping public understanding and policy, they are often affected by significant limitations that can compromise their accuracy and consistency. Variations in how crimes are classified, coupled with social stigma and victims’ hesitance to report certain offenses, contribute to underreporting. Additionally, law enforcement agencies’ priorities and resource distribution can influence which crimes are documented more thoroughly, leading to regional disparities. Because of these factors, comparing crime data across different time periods or locations requires careful consideration, as raw numbers alone may not provide a complete picture.
Key contributors to inconsistencies in crime data include:
- Legal Definition Variations: Different jurisdictions may classify the same behavior under distinct crime categories.
- Reporting Approaches: Some police departments actively encourage reporting, while others depend on incidents reported voluntarily.
- Data Management Issues: Errors or delays in data entry and processing can affect the timeliness and accuracy of crime statistics.
- Victim Reporting Tendencies: Crimes such as domestic violence and sexual assault are frequently underreported due to sensitivity.
| Influencing Factor | Effect on Crime Data |
|---|---|
| Jurisdictional Differences | Leads to inconsistent crime categorization and reporting |
| Victim Reporting Behavior | Results in undercounting of sensitive crimes |
| Law Enforcement Focus | Resource allocation impacts crime detection and recording |
| Administrative Processing | Delays and errors can distort real-time data accuracy |
How Classification and Reporting Practices Shape Crime Data Integrity
The precision of crime statistics is deeply affected by the methods used to classify and report offenses. Disparities in definitions, reporting standards, and local enforcement policies can create inconsistencies that complicate efforts to portray a unified national crime landscape. For instance, what one city labels as aggravated assault might be categorized differently elsewhere, making direct comparisons misleading. These discrepancies underscore the necessity of contextualizing crime data rather than accepting it at face value.
Factors influencing these variations include:
- Classification Guidelines: Differences in crime coding and categorization protocols.
- Reporting Motivations: Agencies may underreport or reclassify crimes to reflect perceived improvements in public safety.
- Human Error: Mistakes during data entry or submission can introduce inaccuracies.
| Factor | Effect on Data Quality |
|---|---|
| Classification Guidelines | Causes discrepancies in crime type counts across regions. |
| Reporting Motivations | May distort crime trends to appear more favorable or severe. |
| Human Error | Introduces inaccuracies that undermine data reliability. |
Guidelines for Responsible Interpretation and Application of Crime Data
While crime statistics are invaluable for tracking trends and guiding policy decisions, they must be interpreted with caution to avoid misleading conclusions. It is crucial to scrutinize the origin of the data and the methodologies employed in its collection. Factors such as shifts in reporting protocols, demographic changes, or intensified law enforcement efforts can influence crime rates without necessarily indicating real changes in criminal activity. Combining multiple data sources—official reports, victim surveys, and independent research—can yield a more comprehensive and accurate understanding.
When analyzing or presenting crime data, clarity and transparency are essential. Clearly define crime categories and time periods to prevent misunderstandings. Distinguish between raw counts and per capita rates, as the latter provide more meaningful comparisons across different populations or time frames. Consider the following best practices for ethical and effective use:
- Ensure Data Currency: Utilize the most recent data available to reflect current realities.
- Recognize Data Limitations: Acknowledge potential biases and gaps inherent in crime data collection.
- Contextualize Statistics: Relate findings to socioeconomic conditions, demographic trends, and local policies.
- Maintain Objectivity: Avoid sensationalizing data or overstating crime risks.
| Aspect | Recommended Practice |
|---|---|
| Data Origin | Assess reliability and collection techniques |
| Comparison Metrics | Use standardized rates per 100,000 population instead of raw numbers |
| Time Frame Consistency | Ensure uniformity in reporting periods across datasets |
| Societal Factors | Incorporate economic, demographic, and policy contexts |
Final Thoughts
Grasping the intricacies of crime data reporting is vital for interpreting statistics accurately and fostering accountability among institutions. As this analysis reveals, the processes of data collection, classification, and reporting are complex and can significantly influence public perception and policy formulation. By approaching crime statistics with a discerning mindset and appreciating the underlying nuances, readers can better navigate the often conflicting narratives about crime trends. Staying informed about these factors ensures that discussions on crime are rooted in factual understanding rather than misconceptions.